Rubyのgnuplotで時系列データをプロット
RubyのGnuplot gemから、時系列データをプロットするときの例。基本的にgnuplotのコマンドラインでやっているように、
- set timefmt '%Y-%m-%dT%H:%M:%SZ'
- set xdata time
- set format x "%H:%M"
を、plotオブジェクトに対してコールしてあげればよい。Ruby + Gnuplotは、ネット上に全然サンプルが載っていないので、たまに大変なのですが、文字列処理やM2XのWeb APIと組み合わせて、簡単にプロットしたいときにはとても便利なのです。
インストールや基本的な使い方は過去の記事「Rubyからgnuplotを使ってグラフを描画・保存する例」を参照してください。
ソースコード
gistにも上げてあります。
Plot time-series data using Ruby Gnuplot - gist
1
2
3
4
5
6
7
8
9
10
11
12
13
14
15
16
17
18
19
20
21
22
23
24
25
26
27
28
29
30
31
32
33
34
35
36
37
38
39
40
41
42
43
44
45
46
47
48
49
50
51
52
53
54
require "gnuplot"

data=&&&&<&&&&<EOS
2016-07-19T23:47:53.432Z 33.2
2016-07-19T23:41:59.558Z 33.1
2016-07-19T23:36:06.183Z 32.9
2016-07-19T23:30:09.101Z 32.7
2016-07-19T23:24:15.936Z 32.6
2016-07-19T23:18:19.082Z 32.4
2016-07-19T23:12:20.944Z 32.4
2016-07-19T23:06:28.191Z 32.3
2016-07-19T23:00:35.459Z 31.6
2016-07-19T22:54:33.798Z 31.2
2016-07-19T22:48:31.436Z 30.7
2016-07-19T22:42:27.744Z 30.1
2016-07-19T22:36:30.776Z 29.7
2016-07-19T22:30:32.814Z 29.4
2016-07-19T22:24:38.774Z 28.8
2016-07-19T22:18:38.911Z 28.5
2016-07-19T22:12:45.805Z 28.2
2016-07-19T22:06:39.124Z 27.7
2016-07-19T22:00:39.920Z 27.1
2016-07-19T21:54:42.007Z 26.5
EOS

x = []
y = []
data.lines(){|line|
	a=line.split()
	x &&&&<&&&&< a[0]
	y &&&&<&&&&< a[1]
}

Gnuplot.open() do |gp|
    Gnuplot::Plot.new( gp ) do |plot|
    	plot.ylabel 'Temperature degree'
    	plot.xlabel "Time (starting at #{x[0]})"
    	plot.timefmt "'%Y-%m-%dT%H:%M:%SZ'"
    	plot.xdata "time"
    	plot.format "x '%H:%M'"
    	plot.style "data lines"
    	plot.set 'terminal postscript color eps enhanced font "Helvetica,13" size 16cm,8cm'
    	plot.set "output 'temperature-pcb.ps'"
    	plot.data &&&&<&&&&< Gnuplot::DataSet.new( [x, y] ) do |ds|
    		ds.with = "linespoints"
    		ds.linecolor = "black"
    		ds.linewidth = "3"
    		ds.notitle
    		ds.using = "1:2"
    	end
    end
end

`ps2pdf temperature-pcb.ps`
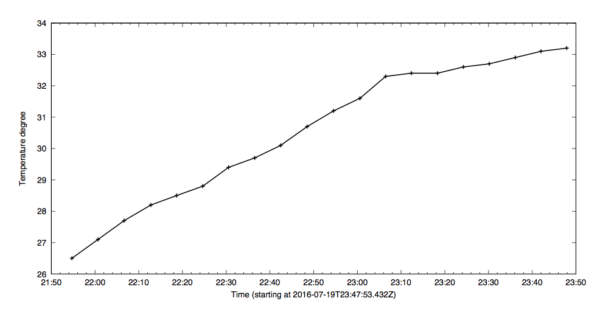
実行結果のサンプル