numpy.fftのテンプレート
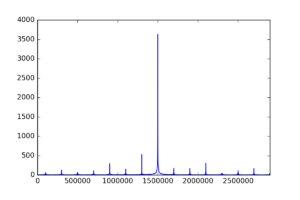
matplotlibのテンプレートにつづいて、numpyでFFTするときのテンプレートです。1.5 MHzのsin関数を5.8MHz 4ビット分解能のADCで5000点サンプルしたときの結果です。np.fft.fftfreq()関数で周波数軸も求められるので、Hzで表示しています。
GistにはJupyter Notebookをそのままアップロードしておいたので、プロット結果、sin.textの中身とあわせて見ることができます。
1
2
3
4
5
6
7
8
9
10
11
12
13
14
15
16
17
18
19
20
21
22
23
24
25
26
27
28
29
30
31
32
33
34
35
36
37
38
39
40
41
42
43
import matplotlib.pyplot as plt
import numpy as np

# Constants
dataFile = "sin.text"
samplingFreq = 5.8e6
samplingPeriod = 1/samplingFreq

# Read data
# 数字が文字として並んだテキストファイルを読み込む。
# sin.textは、sinを4ビットでサンプルした値が5000個並んだデータ。
dataString = open(dataFile).read()
n = len(dataString)
d = np.zeros(n)
for i in np.arange(n-1):
    d[i]=int(dataString[i])

# Subtract the DC component
d = d - np.mean(d)

# FFT - X axis
fftfreq = np.fft.fftfreq(n, samplingPeriod)

# FFT - Y axis
fft = np.fft.fft(d)[0:n/2]
fftmag = np.abs(fft)

# FFT - Plot
fig, panel = plt.subplots(1,1)
panel.set_xlim(0, fftfreq[:len(fftmag)][-1])
# panel.set_ylim(1e-1,1e4)
# panel.set_yscale("log")
panel.plot(fftfreq[:len(fftmag)], fftmag)

# Save figure
fig.savefig("fft_sample.png", dpi=200)

# Maximum power bin and frequency
binIndexMaxPower = np.argmax(fftmag)
freqResolution = samplingFreq / n
freqMaxPower = binIndexMaxPower*freqResolution
print "Maximum-power bin       : {:d}".format(binIndexMaxPower)
print "Maximum-power frequency : {:.3f}".format(freqMaxPower)